


Don’t you love this time of the year? The anticipation is growing, tryouts are happening, and League Ops is way overworked. It’s the change from Season 11 to Season 12, and with it, new faces, storylines, and scrim bots will make their mark on MLE history. It can be argued that the beginning of every MLE season starts with the selection of franchise managers, or even when the rulebook is released, but I respectfully disagree. Each new season doesn’t feel like it has truly arrived until the MLE Draft Lottery. It’s the first stream of the season, it’s the first bit of hype, and most importantly, it’s the first time we get to hear Sleegi’s beautiful voice. This is where trades are born, dreams come to fruition, and hopes will die. It’s the first step of a new chapter in MLE’s illustrious history, and it’s one we should all be excited for.
So what is the draft lottery?
A draft lottery is a randomized way to determine the draft order for each league. Each team that didn’t make the playoffs in a given league, and in FL and PL’s case new franchises, are put into a weighted lottery by their previous season’s record which determines the draft order. The weighted system is linear and pretty easy to follow. The worst team in AL, CL, and ML the season before gets 36 chances to win the lottery. The second-worst team gets 34 chances, the third-worst gets 32, and so on. The team with the best record that barely missed a spot in the postseason only gets 2 chances.
When you add it all up, that creates 342 total chances for teams to get picked. The format for the lottery is also simple. When a team gets picked, their remaining chances are discarded, and a new team is picked until all 18 teams are chosen and the draft order is set. For example, if the worst team the season prior was randomly chosen to get the first pick, their other chances are discarded, and we are left with 306 total chances to determine the second pick.
FL and PL have the same format, just the weighted system is a bit different. There are only 4 teams that missed the playoffs that still have a team in those leagues (since every two seasons, franchises switch having FL and PL teams), so out of those 4 teams, the worst record among them will have 8 chances, second-worst has 6, third-worst has 4, and the team that had the best record of those 4 only has 2 chances. The 8 franchises that will debut this season in each league get 5 chances each, putting them right in the middle of the pack to ensure fairness, creating a total of 60 chances each for each of these 2 lotteries.
What does this mean for the Draft?
The implications behind the draft lottery are huge, especially because MLE has reversed course from the snake draft they did last season. Having the first or third pick puts a franchise in a much better position than having the fourteenth or eighteenth pick would, and because it is a standard draft format, a team would have the added benefit of choosing early in the second and third rounds as well. A higher draft pick also means teams have more leverage in trades because the first overall pick has much more value than the sixteenth pick. Moving back or forward in the draft is very possible based on how the lottery goes.
For teams like the Hawks and the Elite, who had all leagues make playoffs they will have zero teams in the lottery. This means it’ll be very hard to get picks better than what they have. PL’s lottery is especially intriguing, because with no salary cap, the best PL players will go off the board first, and as we saw last season, that can really impact your chances of winning a title. Finally, for teams that have not locked in retentions yet, the draft lottery could be important in making those decisions. If a team wants to retain three players but gets the first pick in the draft, is it still worth retaining all three? Or do you decide not to retain a player so you get the first choice in the draft? The lottery has a chance to impact the league in ways like this and could go on to help or hurt a team later on based on their decision.
So how do I predict this draft?
Now that we know how important the draft lottery is and how it works, I’m sure you are thinking about where certain teams might land. You may be asking yourself questions like what are the chances the Bulls get the first pick in ML? Luckily for you, I decided to do the math. A lot of math. Way, way, way too much math, just so you don’t have to. With help from DK, we answered a list of some of the lottery’s biggest questions: what are the odds a team wins the lottery in a certain league, what are the odds a franchise gets at least one number one pick, and where will my team probably be picking? I’m here to help, so sit back, buckle up, and enjoy the ride.
Chances to Win Each Lottery
So, what are the odds the Bulls win the first pick in ML? In order to calculate this, we take their placement in the league last season, figure out how many chances they have, and then divide it by the total number of chances for the league. This one was pretty easy to calculate, the harder math comes later on. So here are your odds for AL, CL, and ML.
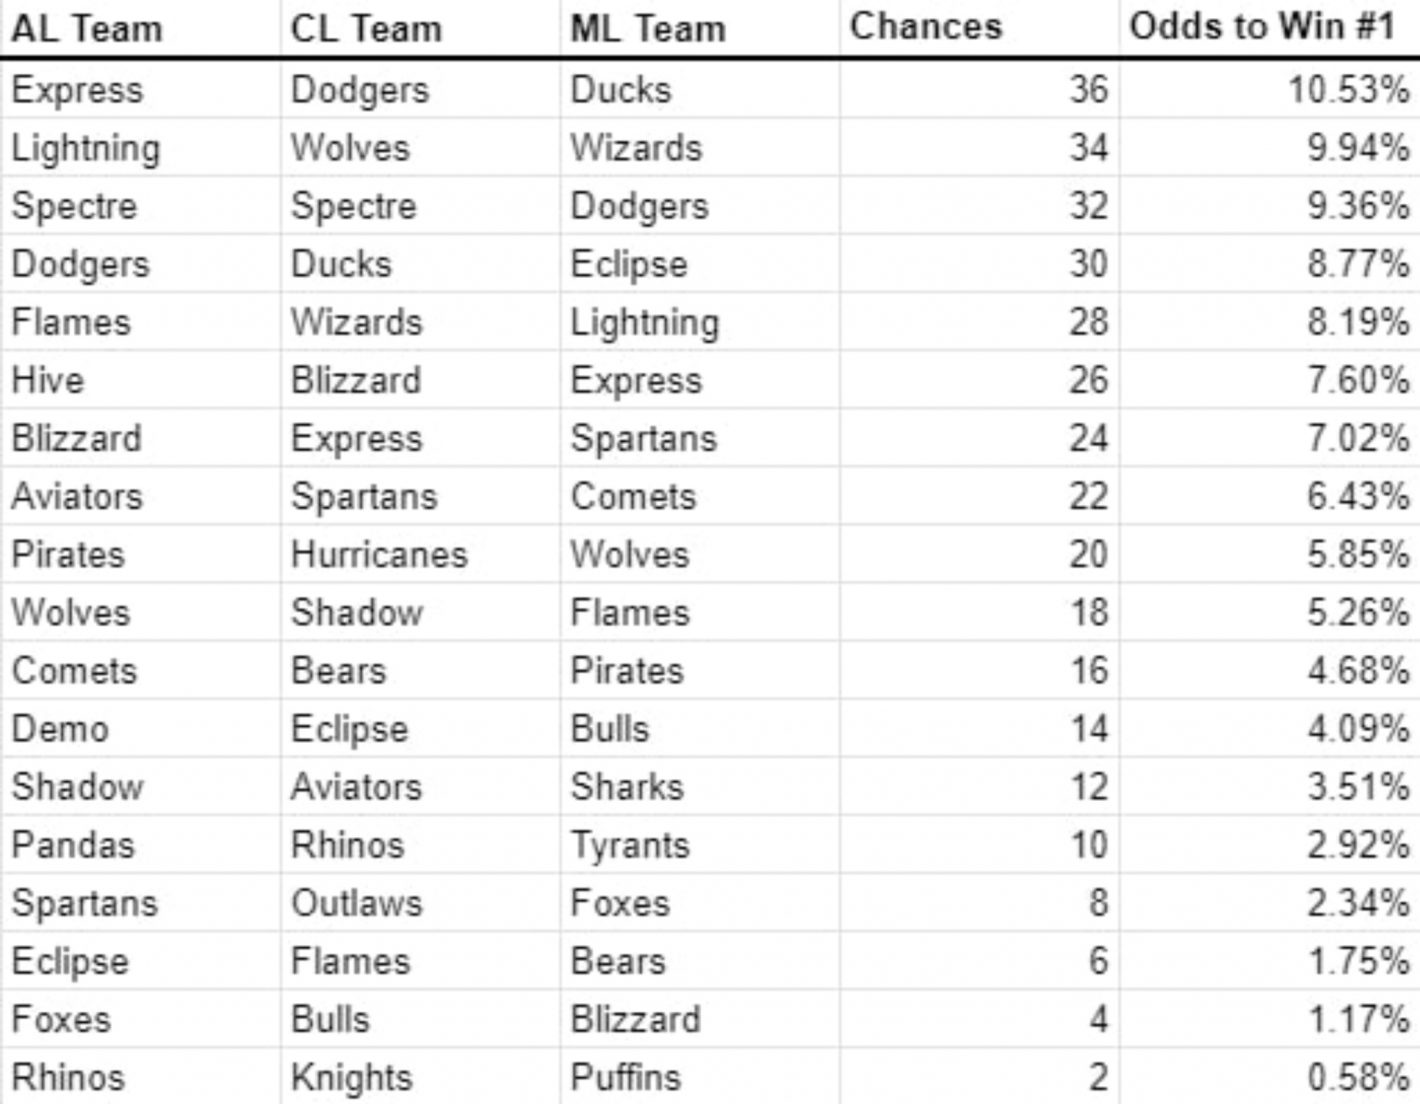
There is a lot to dissect here in this graph. The first thing to notice is even the teams with the best chance to land the first pick only has a 10.53% of getting it, which means there is an 89.47% they don’t. A lot of the top teams will fall towards the middle of the draft because there is a relatively low chance they get picked early on (more on that later in this article). That being said, the first pick is always the one that has the most variance, as a lot of teams could make a claim to get it. Even the team with the tenth best odds still has over a 5% chance to get the first pick.
This is what makes the draft so exciting because there are so many ways the lottery could go. One scenario that seems very unlikely though is the bottom teams winning. At just a .58% chance, the Rhinos AL team, Knights CL team, or Puffins ML team winning the lottery has a 1 in 172 chance of happening. It’s a safe bet that it won’t happen this season, but nothing is impossible, stranger things have happened in MLE. Don’t worry FL and PL, I didn’t forget about you, your odds are below.
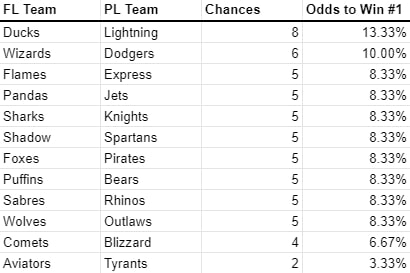
The first thing to point out with these odds is the fact that the bottom teams, Aviators FL and Tyrants PL, have a much higher chance to get the first pick than their counterparts in AL, CL, and ML, 5.7 times more likely to be exact. There’s a decent chance we see a bottom team jump a higher team in at least one of these drafts because of this fact. Speaking of the more likely teams, the team with the best odds may only have 8 chances to get the first pick, but because there are only 60 chances total, their odds of getting the first pick are actually better than those in the higher leagues. Eleven of the twelve teams in the lottery have above a 5% chance to get the first overall pick, so every team believes they have a decent shot. This will make for a ton of drama by the time the lottery comes.
Franchise Odds
If you are part of a franchise’s staff or even just a retention, I’m sure you have a stake in what happens during the lottery. Every franchise dreams of having at least one number one pick, so what are the chances that happens? To calculate this piece of nifty info, we took every team’s odds of getting the first pick league and flipped it, and we ended up with what the odds were that they don’t get the first pick for a given league. When you multiply those all together, subtract it from one, and change it to a percentage, you end up with the table below.
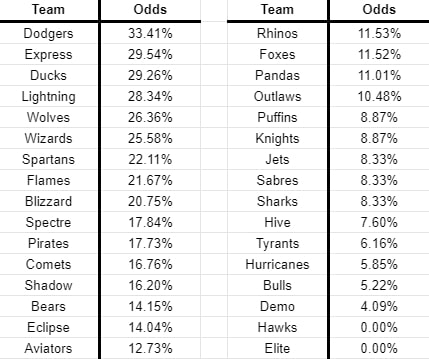
This chart tells us what the odds are that a franchise wins at least one lottery. First, let’s have a moment of silence to commend the Hawks and the Elite. Both of these franchises got all of their teams to the playoffs last season and do not switch between FL and PL this season, so they come into the lottery with no teams in it, hence the 0% chance. They can kick back and watch every other franchise freak out over their picks. As for the other 30 teams, these are your odds.
There are six franchises with at least a one-in-four chance of going home with at least one number one pick, the highest being the Dodgers, who have all four teams in the lottery. They have a whopping 33.41% chance to get the first overall pick in at least one league. The Ducks come in with only three teams, but still, have a massive 29.26% chance of landing at least one first pick. The Jets, Sabres, and Sharks all had their AL, CL, and ML teams make the playoffs last season, and since they will have a team entering either FL or PL for the first time, they come in with the same odds.
The Puffins and Knights had two of their three AL, CL, and ML teams making the playoffs, and have a team entering FL or PL this season. However, their teams that missed the playoffs were about the same, with the Knights being the best team to miss the CL playoffs and the Puffins being the best team to miss the ML playoffs, so their odds are equal. Twenty teams have odds over 10%, so there may be a lot of wishful thinking come lottery time, you do not want to miss it so definitely tune in!
Average Draft Position
We have talked extensively now about the first pick in the draft, but there is so much more on the line than the first pick being selected. There are 18 picks determined by the lottery in AL, CL, and ML, and 12 picks in FL and PL. Wouldn’t it be cool if we could know where teams will pick for each league on average? Well, that’s what I set out to do.
I first googled to see if there was a website that could do it for me to no avail. I then decided that I would run 250 simulations of the draft by hand, type in the results, and share it with you all, but after seeing that 250 was not a big enough number to get accurate data, and me being bored of typing numbers, I knew something had to change.
So, I reached out to the best spreadsheet people I knew and asked them to help me on my journey. Enter DK, my savior and a man who knows his way around Google Sheets. He made a program that simulated a draft lottery 100,000 times and logged each and every one of them. This program assigned a number to each pick, one for the first pick, two for the second, etc. When the 100k simulations were done, he added them up, divided the total by 100k, and we had an average draft landing spot for each team in the lottery.
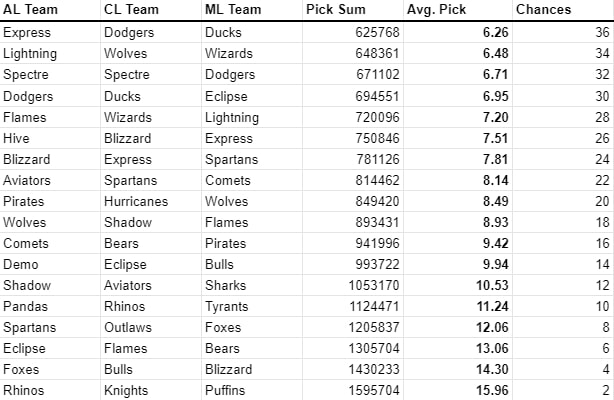
That is a lot of data, and hats off to DK for being able to come up with this glorious finished product, but I’ll start combing through it. Let’s start towards the top of the chart where the Express, Dodgers, and Ducks have the most chances for their respective leagues. Even though they have the most chances, they still on average will pick around sixth. That’s a big drop for the teams that are supposed to have the best odds.
Most GMs or FMs watching may be disappointed if they drop to sixth when having the best odds, but that is still better than what they were calculated to finish at, which is why this table is so important. Comparing a team’s final position to this chart (and the one below for FL and PL) tells a team how fortunate or unlucky they were in the lottery. The average picks toward the top of this list are so close together, that there is virtually no difference, making the beginning of the lottery so tough to predict. As you go down, however, you’ll realize that the gap between teams starts getting bigger and bigger.
It’s hard for teams with fewer odds to jump up because they are constantly outnumbered, so there’s a better chance they stay towards the bottom. For example, let’s say the Pandas and the Rhinos are the last two teams left in AL. The Rhinos will only have 2 chances while the Pandas have 10, making it 5x more likely the Pandas get selected. In over half of the simulations I did by hand, the team with the least amount of chances picked last. So while the teams at the top of the chart may fall a lot of picks, it’s very unlikely the teams at the bottom will rise much. Let’s take a look at FL and PL quickly.
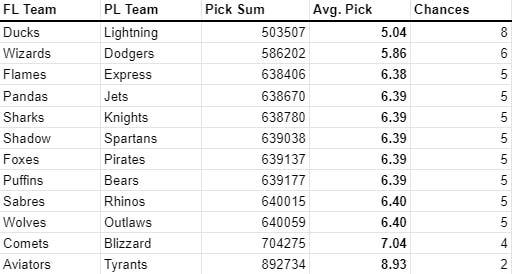
One problem with running a simulation as many times as we did is that numbers may not be 100% accurate. Look at the middle eight teams in the chart, even though they have the same amount of chances, and therefore the same odds, the average draft pick positions are different (just by a tad). The more simulations you run, the more likely the odds even out, but apparently 100k simulations were not enough to accomplish this. In reality, each of these teams has an average draft position of 6.39. I wanted to keep the data set so you can see how we did it, but that aspect of the data is not completely accurate, however, it is very close.
When we look at the data, the teams at the bottom are much more likely to move up than their AL, CL, and ML counterparts. This is because the total number of changes in these lotteries is so much lower than the others, 60 compared to 372. That means the 2 chances for the Aviators and Tyrants are way more significant, however, they still will probably get a low pick. The Ducks and Lightning, who are at the top, will have an average pick position of about fifth. Going from the highest odds to mid-draft on average isn’t ideal, but it’s still not bad.
That was a lot of information, but now you know pretty much everything you’ll need to know for the MLE Draft Lottery. The start of the season is officially around the corner and this is just the beginning, so you won’t want to miss it! The Draft Lottery will stream live Sunday, March 21s at 5 PM EST on https://www.twitch.tv/leachylive


